

MD&A · 2025
In this section4 topics
Overview of Operations
Overview of Operations
Overview of Business Operations, Economy, and Industry Conditions Affecting Performance
The Company operates in the development and provision of enterprise software systems, with a focus on delivering solutions on the Low-code platform under Mendix, a global platform under Siemens that enables rapid application development and seamless integration with large enterprise systems. This approach helps reduce development time, increase flexibility in customizing systems to meet client needs, and improve efficiency in project delivery. The Company’s main customer base consists of organizations undergoing Digital Transformation and seeking to enhance operational efficiency under constraints in IT human resources.
Although the global economic environment continues to face volatility from interest rates, inflation, and geopolitical uncertainties, most organizations remain committed to investing in information technology.
In particular, projects that enhance productivity, reduce costs, and support strategic decision-making continue to be prioritized. Areas such as Automation, Data Analytics, and Artificial Intelligence (AI) are viewed as key mechanisms for creating competitive advantage (Gartner, 2025).
From an industry perspective, Low-code application development platforms continue to show strong growth trends. Currently, AI has been systematically integrated into development platforms, referred to as AI-Native Development Platforms. This integration enables faster and more intelligent system design, development, and enhancement (Gartner, 2025). The integration of AI with Low-code not only shortens project timelines but also increases the value of enterprise solutions, particularly in areas such as Workflow Automation, advanced data analytics, and decision support systems.
In response to these trends, the Company continues to enhance its personnel capabilities and further develop solutions on the Mendix platform, together with the application of AI technologies. This strategy aims to strengthen the Company’s competitiveness, meet enterprise client needs, and support sustainable long-term growth.
Key Events during the Period
April 2025
The Annual General Meeting of Shareholders for the year 2025 resolved to approve the payment of a cash dividend for the Company’s performance in the fiscal year 2024, based on the separate financial statements for the period from January 1 to December 31, 2024. The approved dividend was THB 0.19 per share, totaling THB 19.00 million, representing 96.74% of the net profit of THB 19.64 million. The record date for determining the right to receive the dividend was May 7, 2025, and the dividend payment was scheduled for May 23, 2025.
August 2025
The Company received an “Excellent” rating with a perfect score of 100 points in the 2025 Annual General Meeting (AGM) Checklist for the second consecutive year. The assessment was conducted by the Thai Investors Association (TIA) in collaboration with the Thai Capital Market Business Council. This recognition reflects the Company’s commitment to equitable treatment of shareholders, transparent disclosure, and strict adherence to good corporate governance practices.
f
f
f
f
October 2025
The Company was certified as a member of the Thai Private Sector Collective Action Against Corruption (CAC) on 30 September 2025, with a certification term of three years. This achievement demonstrates the Company’s strong commitment to transparent operations and ethical business conduct.
The Company also received a 5-star “Excellent” rating in the 2025 Corporate Governance Report (CGR) of Thai Listed Companies for the second consecutive year and was ranked in the Top Quartile among 85 companies out of 333 listed companies in the market capitalization group not exceeding THB 1,500 million. The assessment was conducted by the Thai Institute of Directors Association (IOD) in collaboration with the Stock Exchange of Thailand (SET), highlighting the Company’s ongoing efforts to strengthen its corporate governance standards.
In addition, the Company was included in the Thai ESG or Thailand ESG Fund securities list, reflecting its commitment to conducting business based on comprehensive sustainability principles encompassing environmental, social, and governance (ESG) dimensions.
f
Operating Results & Financial Condition
Operating Results & Profitability
Revenue and Gross Profit by Service Type
f
f
f
f
f
f
f
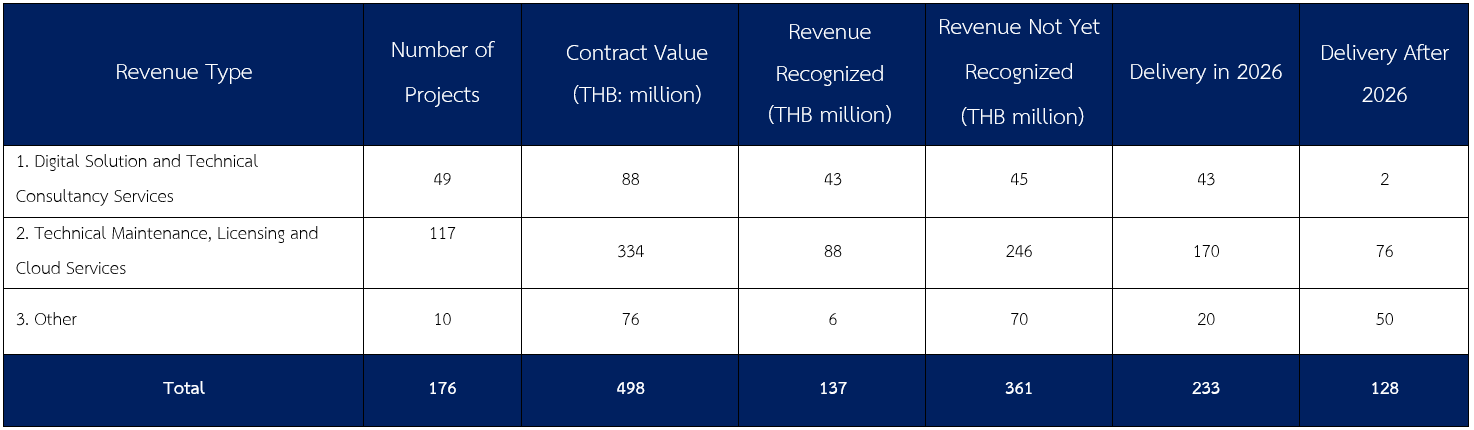
As at 31 December 2025, the Company had ongoing projects that have not yet been delivered (Backlog) as follows:
f
Revenue and Gross Profit from Digital System Development and Consulting Services

f
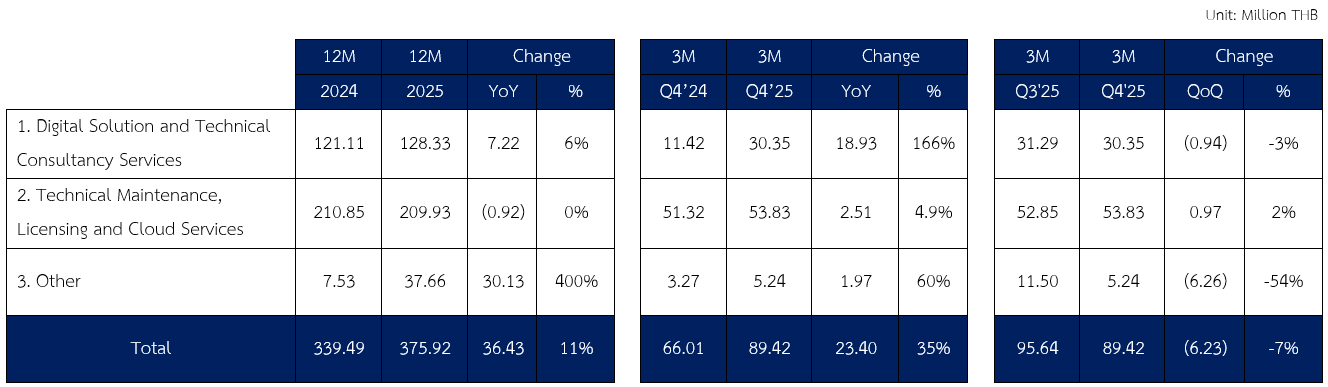
Revenue from digital system development and consulting services, on a full-year (12M) basis, increased compared to the prior year. The primary driver was the low revenue base in Q4 of the previous year.
In Q4 of last year, the Company revised downward the progress recognition of a large-scale project following an extension of the project timeline. As a result, revenue recognized in that quarter declined significantly, bringing the prior year’s revenue base below its normal level.
Accordingly, the revenue growth in 2025 compared to the previous year (Year-on-Year) was mainly attributable to the low base effect.
Excluding the impact of the downward revision of progress recognition in 2024, revenue growth this year remained slightly subdued. This reflects the slowdown in the technology sector, which has affected customers’ investment decisions and resulted in a decline in new project inflows.
f
Gross Profit from Digital System Development and Consulting Services
Gross profit for 2025 decreased compared to the prior year, despite higher revenue. The primary factor was increased personnel costs, as revenue growth was insufficient to fully absorb the higher cost base, resulting in a decline in the overall gross profit margin compared to the same period last year.
However, on a year-on-year basis for the same quarter, gross profit increased. This was primarily driven by a significant increase in revenue in the current quarter, compared to the low revenue base in the prior year, which resulted from the downward revision of progress recognition. Therefore, the YoY increase in revenue and gross profit was primarily driven by the base effect, rather than reflecting the Company’s underlying operating performance.
Compared to the previous quarter (QoQ), gross profit improved due to lower personnel-related expenses, such as overtime and other employee benefits, while revenue remained relatively stable. As a result, the gross profit margin increased compared to the prior quarter.
f
f
f
f
f
f
Revenue and Gross profit from Technical Maintenance, Licensing and Cloud Services

f
Revenue from Technical Maintenance, Licensing and Cloud Services
Revenue from system maintenance and technology support services remained relatively stable compared to the prior year across YoY and QoQ comparisons. This reflects continued customer retention with a low churn rate, resulting in consistent revenue from this segment.
f
Gross Profit from System Maintenance and Technology Support Services
The gross profit margin of the System Maintenance and Technology Support Services segment remained largely in line with the previous year. This reflects the relatively stable revenue and cost structure of this segment, as the services are provided under ongoing contractual arrangements.
However, on a quarterly basis, the gross profit margin slightly declined compared to both the corresponding quarter of the previous year (YoY) and the previous quarter (QoQ). The main factor was the increase in maintenance service costs in line with the agreed Service Level Agreements (SLAs) with customers, which resulted in a slight decrease in the segment’s gross profit margin during the period.
f
Revenue and Gross profit from other Services

f
Revenue from Other Services
Revenue from other services increased for the year, driven by additional service streams beyond Mendix in 2025, including credit management and debt collection system services, as well as other product sales. This reflects a positive signal from the expansion of new recurring service revenue streams in the future.
On a Quarter-on-Quarter (QoQ) basis, revenue fluctuated in line with the timing of project deliveries.
f
Gross Profit from Other Services
Gross profit showed slight changes on a Year-on-Year (YoY) basis. However, on a Quarter-on-Quarter (QoQ) basis, gross profit declined significantly. This was because the previous quarter included deliveries of existing products with high margins. In the current quarter, no such transactions occurred, and operations returned to normal levels, resulting in lower gross profit compared to the previous quarter.
f
f
f
f
f
f
f
Selling and administrative expenses and SG&A to sales

f
Selling and Administrative Expenses
Selling and administrative expenses slightly increased on a Year-on-Year (YoY) basis compared to the previous year.
The primary driver was higher personnel-related expenses, resulting from the expansion of the sales team to support business operations, as well as annual salary adjustments in accordance with the Company’s policy.
However, on both a Quarter-on-Quarter (QoQ) and Year-on-Year (YoY) basis, selling and administrative expenses decreased. This was mainly attributable to the reversal of expected credit loss (ECL) provisions, as the Company was able to collect receivables that had previously been provided for during the period.
f
SG&A to Sales Ratio
The SG&A to Sales ratio for 2025 (YOY) and on a Quarter-on-Quarter (QoQ) basis remained close to the previous year. This reflects effective cost management and expense control under a business environment that continues to experience volatility.
However, compared to the same period of the prior year, the SG&A to Sales ratio declined significantly.
The primary driver was a base effect, as in the fourth quarter of 2024 the Company revised the progress recognition of a project downward, resulting in lower revenue while SG&A expenses remained at a normal level. Consequently, the ratio during that period was elevated.
The decline in the ratio in 2025 therefore mainly reflects the lower comparison base, rather than any structural change in the Company’s cost structure.
The SG&A to Sales ratio in 2025 was approximately 17–20%, remaining within the Company’s normal cost structure and in line with the current level of operations.
f
Net Profit and Net Profit Margin
Although revenue for 2025 increased compared to the prior year, net profit and net profit margin declined, primarily due to high fixed personnel costs.
However, on a Year-on-Year (YoY) quarterly basis, net profit and net profit margin increased as revenue in the same quarter of the prior year was significantly lower, following the downward revision of progress recognition for a project.
Compared to the previous quarter (Quarter-on-Quarter: QoQ), net profit and net profit margin increased slightly, with no significant change.
f
Additional details concerning profitability can be found at:
f
f
f
f
f
f
f
f
Liquidity & Capital Adequacy
Key Financial Ratios
Financial Ratios | Unit | 2024 | 2025 | Increase (Decrease) |
Current Ratio | Times | 4.58 | 4.03 | -0.55 |
Gross Profit Margin | % | 25.47 | 24.53 | -0.94 |
Interest bearing debt to equity ratio (IBD/E) | Times | 0.07 | 0.05 | -0.02 |
f
In 2025, the Company maintained strong and stable financial ratios. The key highlights are summarized as follows.
The current ratio stood at 4.03 times, compared to 4.58 times in the previous year. Despite the decrease,
the ratio remained at a high level, reflecting the Company’s sufficient liquidity to meet its short-term obligations.
The gross profit margin was 24.53%, decreasing from 25.47% in the previous year. The decline was mainly due to higher fixed costs, while revenue from higher-margin segments decreased. As a result, overall profitability slightly declined.
The interest-bearing debt to equity ratio was 0.05 times, decreasing from 0.07 times in the previous year.
This reflects a strong capital structure and a low level of financial risk.
f
Additional details concerning liquidity and capital adequacy can be found at:
f
f
f
f
f
f
f
f
f
Asset Management Capability
Financial Position Report as of December 31, 2025
f
Assets
(Unit: Million (Thb)) | As of 31 2024 | As of 31 2025 | Increase (Decrease) | |
Amount | % | |||
Cash and Cash Equivalents | 235.93 | 151.84 | -84.09 | -36% |
Short-Term Investments | 163.61 | 306.33 | 142.72 | 87% |
Trade Receivables and Accrued Income | 200.79 | 176.44 | -24.35 | -12% |
Other Current Assets | 4.86 | 4.96 | 0.10 | 2% |
Restricted Bank Deposits | 13.63 | 14.63 | 1.00 | 7% |
Property, Plant and Equipment | 8.49 | 6.39 | -2.10 | -25% |
Right-of-Use Assets | 35.10 | 24.18 | -10.91 | -31% |
Intangible Assets | 7.36 | 8.12 | 0.76 | 10% |
Investment in Associate | 2.50 | 1.54 | -0.96 | -39% |
Income tax refundable | 6.24 | 3.47 | -2.77 | -44% |
Deferred Tax Assets | 5.32 | 6.86 | 1.55 | 29% |
Other Non-Current Assets | 2.53 | 2.53 | 0.00 | 0% |
Total Assets | 686.35 | 707.30 | 20.94 | 3% |
f
As of 31 December 2025, the Company’s total assets amounted to THB 707.30 million, representing an increase of THB 20.94 million, or 3%, compared to 31 December 2024. The key changes in significant items are summarized below:
f
f
f
f
f
f
Cash and Cash Equivalents
As of 31 December 2025, the Company’s cash and cash equivalents decreased compared to the previous year. The primary reason was the reclassification of fixed deposits amounting to THB 140 million to
short-term investments (temporary investments), in accordance with the nature of the instruments and the intended holding purpose.
However, excluding the impact of such reclassification, the Company’s cash and deposit balances increased compared to the end of the previous year.
The changes in cash and cash equivalents from operating, investing, and financing activities are summarized as follows.
Unit: Million Baht
Net Cash Provided by (Used in) Operating Activities | 84.98 |
Net Cash Used in Investing Activities | (141.86) |
Net Cash Provided by (Used in) Financing Activities | (27.20) |
Net Increase (Decrease) in Cash and Cash Equivalents | (84.09) |
f
Trade Receivables and Accrued Income
As of 31 December 2025, trade receivables and accrued income decreased compared to the prior year. The decline was mainly attributable to project timing, as the Company progressively delivered and recognized revenue from existing projects. In addition, revenue toward the end of the year slowed in line with the commencement schedule of new projects, resulting in a reduction in work in progress and outstanding receivables in accordance with the normal project cycle of the business.
The aging of trade receivables and accrued income is presented as follows.
Trade Receivables
Age of Receivables | Amount | Reason |
Not yet due | 63.12 | - |
Overdue within 3 months | 13.04 | Partially settled in January 2026, with the remaining balance pending customer payment approval and expected to be collected within the first quarter of 2026. |
Over 12 months | 1.61 | THB 1.61 million relates to a receivable facing liquidity constraints. A full allowance for doubtful accounts (100%) has been provided, and the Company is closely monitoring the collection process. |
Total before allowance for ECL | 77.77 |
f
f
f
f
f
Accrued Income
Age of Receivables | Amount | Reason |
Not yet due | 98.31 | - |
Overdue within 3 months | 2.04 | Currently pending customer approval for invoice issuance and expected to be completed within the first quarter of 2026. |
Total before allowance for ECL | 100.35 |
As of 31 December 2025, the Company recorded an allowance for expected credit loss on accrued income totaling
THB 1.68 million.
f
Debt Obligations & Off-Balance-Sheet Management
Liabilities
Unit : Million Baht | As of 31 December 2024 | As of 31 December | Increase (decrease) in change | |
Amount | Percentage | |||
Trade Payables and Other Payables | 66.65 | 85.51 | 18.86 | 28% |
Deferred Revenue | 47.48 | 54.75 | 7.27 | 15% |
Other Current Liabilities | 7.17 | 6.14 | -1.03 | -14% |
Lease Liabilities | 34.04 | 23.35 | -10.70 | -31% |
Employee Benefit Obligations | 15.32 | 22.06 | 6.73 | 44% |
Provision for Project Losses | 2.65 | 3.83 | 1.18 | 45% |
Provision for Dismantling of Leasehold Improvements | 1.11 | 1.13 | 0.02 | 2% |
Total | 174.42 | 196.76 | 22.34 | 13% |
f
As of 31 December 2025, the Company’s total liabilities increased compared to the previous year.
The increase was mainly due to higher trade payables, in line with the Company’s normal business operations during the period.
f
Shareholders' Equity
Unit: Million Baht | As of 31 December 2024 | As of 31 December 2025 | Increase (decrease) in change | |
Amount | Percentage | |||
Issued and Paid-up Share Capital | 50.00 | 50.00 | - | 0% |
Share Premium | 400.47 | 400.47 | - | 0% |
Retained Earnings | 59.89 | 58.53 | -1.37 | -2% |
Non-controlling Interests | 1.57 | 1.54 | -0.03 | -2% |
Total shareholders' equity | 511.93 | 510.53 | -1.40 | 0% |
f
As of 31 December 2025, the Company’s shareholders’ equity slightly decreased compared to the previous year. The decrease was mainly due to dividend payments made during the period, which reduced retained earnings.
f
Further details concerning debt obligations and the management of off-balance sheet arrangements can be found at:
f
f
f
Material & Related-Party Transactions
For the year ended December 31, 2025, the Company and its subsidiaries did not enter into any material transactions. However, details regarding connected transactions have been disclosed in Part 2: Corporate Governance, Section 9.2: Related Party Transactions.
Debt Securities with Financial Ratio Requirements
Debt Securities with Financial Ratio Requirements Issued?
No
Factors That May Affect Financial Condition
Factors or Incidents That May Materially Affect Financial Condition
Factors Affecting Future Operations and Growth
In 2026, the Company plans to expand its business into Loan Management and Loan Origination solutions, as well as comprehensive debt collection systems. This initiative represents one of the key factors that may support the Company’s growth in the next phase. The Company aims to serve both financial institutions (banks) and non-bank lenders, including leasing companies, personal loan providers, auto title loan operators, digital lending platforms, and other businesses that extend credit to customers.
The market is expected to expand, driven by increasing demand from both banks and non-bank lenders that are placing greater emphasis on asset quality management, credit risk control, and the management of
non-performing loans (NPLs), amid ongoing economic volatility and intensifying competition in the lending industry.
Currently, the Company is developing a credit management platform and a debt collection system, alongside collaboration with specialized technology partners. Since the fourth quarter of the previous year,
the Company has begun to receive initial customer interest and business leads and also closed some deals. The lead pipeline is expected to continue expanding from 2026 onward, which will help establish a new revenue base and increase the proportion of recurring income in the future.
In addition, the Company plans to integrate Artificial Intelligence (AI) into its debt collection processes to enhance the analysis of debtor data and payment behavior. The system is designed to learn from actual data and tailor communication strategies to individual debtors. This may help improve collection rates, reduce long-term personnel costs, and enhance the efficiency of credit portfolio management for clients in both segments.
However, the success of this initiative depends on several factors, including overall economic conditions, regulatory frameworks of relevant authorities, the level of market competition, and the Company’s ability to develop and deliver the solutions in accordance with its implementation plan.
Sustainability Development
The Company conducts its business under a Sustainable Development framework, with Environmental, Social, and Governance (ESG) principles serving as a fundamental foundation in driving the organization.
The Company places importance on balanced operations across all dimensions to create shared value for stakeholders and to support stable and sustainable long-term growth. A summary of key sustainability developments in 2025 is as follows:
The Company continuously strengthened its corporate governance standards and received an “Excellent” rating with a full score of 100 points for two consecutive years in the AGM Checklist assessment conducted by the Thai Investors Association.
The Company participated in the mai Growth Lab program organized by the Market for Alternative Investment (mai) to enhance strategic knowledge and capabilities of listed company executives.
The program also provided a platform for knowledge exchange on the application of Artificial Intelligence (AI) to support business growth.The Company continued to promote knowledge sharing with society and the business community through Tech Day activities held throughout the year. These activities provided technology updates to new customers, business partners, and stakeholders, highlighting the potential of Low-Code technology in enhancing organizational efficiency while fostering sustainable business relationships.
The Company emphasized continuous employee development and technology skill enhancement through internal initiatives such as Tech Day and Docker sessions. Topics included Mendix, Monthly Feature & Widget Talk, Build Your First Widget, and Docker Basics: Containerize Your Applications, among others. These initiatives support continuous learning and strengthen employee capabilities to drive
long-term organizational growth.The Company received an “Excellent” (5-star) rating for the second consecutive year in the Corporate Governance Report of Thai Listed Companies (CGR) assessment conducted by the Thai Institute of Directors (Thai IOD). The Company was also ranked among the Top Quartile Companies (85 out of 333 companies) within the market capitalization group of not exceeding THB 1,500 million, reflecting effective, transparent, and accountable governance practices.
The Company was certified as a member of the Thai Private Sector Collective Action Against Corruption (CAC), reaffirming its commitment to conducting business with integrity, transparency, and zero tolerance for corruption in all forms.
In addition, the Company was selected for inclusion in the Stock Exchange of Thailand’s (SET) “Thai ESG” listed securities, reinforcing its commitment to environmental, social, and governance (ESG) responsibilities and marking an important milestone toward sustainable long-term growth.
During the air pollution crisis, the Company joined the Work From Home Network in collaboration with the Environmental Office to reduce travel, lower carbon emissions, and protect employee health. This initiative reflects the Company’s application of sustainable resource management principles in its operations.
The Company established a Sustainability Strategy Committee to set sustainability policies and drive implementation through practical guidelines. It also allocated budget and resources to support employee development programs and ongoing social, community, and environmental initiatives, while strengthening collaboration with internal and external partners.
The Company received a SET ESG Rating of “A” for 2025. In 2025, 365 listed companies participated in the assessment, of which 265 met the evaluation criteria.
The Company also strictly enforces its No Gift Policy, encouraging business partners and stakeholders to refrain from giving or receiving gifts or any other benefits to executives and employees during festive seasons and special occasions. The policy is intended to prevent conflicts of interest, reduce unnecessary expenses, and promote good governance, integrity, transparency, and fairness. It has been continuously communicated to executives and employees at all levels to reinforce awareness and compliance, in line with the Company’s governance framework and CAC principles.
Projects or R&D Affecting Future Results
N/A